Single-Cell RNA Sequencing
Overview

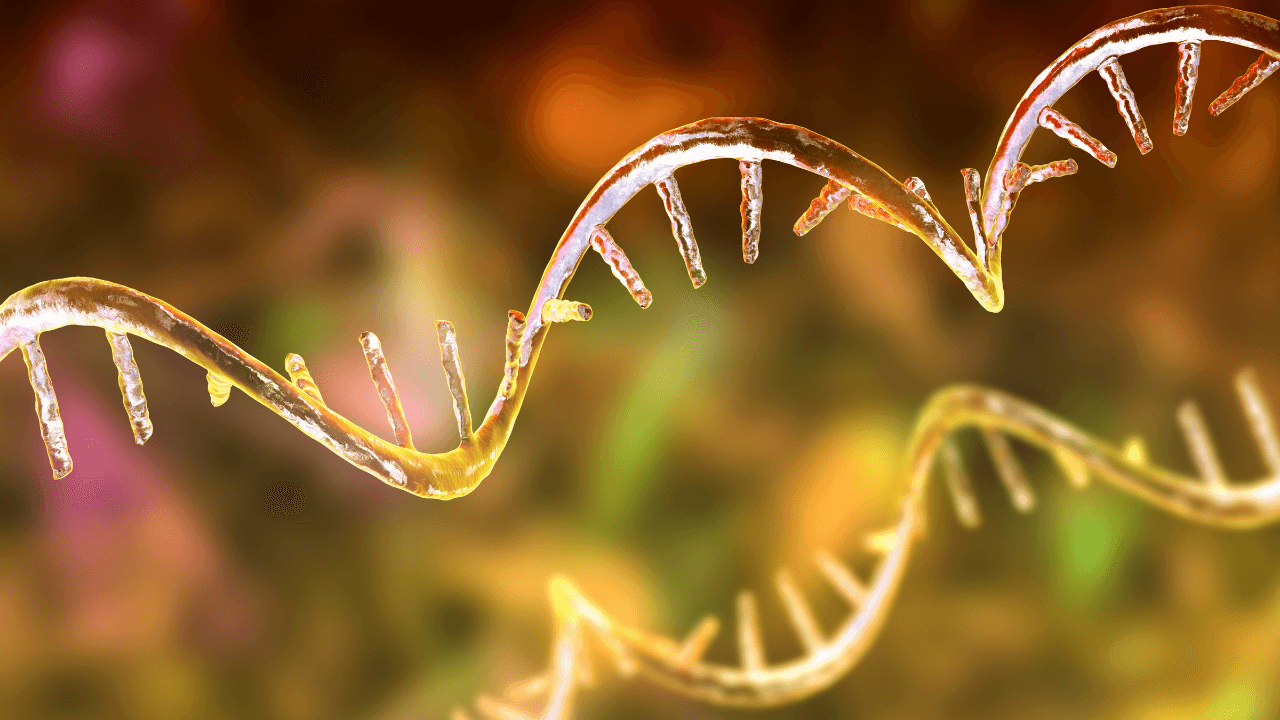
Our Single-Cell RNA Sequencing (scRNA-Seq) analysis service uncovers cellular heterogeneity by transforming raw sequencing data into high-resolution biological insights. From quality control and cell clustering to cell annotation, trajectory inference, and cell–cell communication analysis, we deliver reproducible, publication-ready results using state-of-the-art computational workflows. Whether you're studying cancer, immunology, neuroscience, developmental biology, or regenerative medicine, our analyses help reveal cellular populations, functional states, and underlying biological mechanisms.
Our Workflow

Every bioinformatics project follows a standardized, scientifically validated workflow that ensures reproducibility, transparency, and high-quality results. From understanding your research objectives to delivering publication-ready analyses, our process is designed to produce reliable biological insights for every engagement.

Project Consultation

01

We review your research objectives, experimental design, and sequencing data to define the optimal analysis strategy for your study.

Data Processing

02

Raw sequencing data undergoes quality control, preprocessing, alignment, and normalization using validated bioinformatics workflows.

Bioinformatics Analysis

03

We perform statistical analysis, functional annotation, and biological interpretation tailored to your research objectives.

Biological Interpretation & Delivery

04

Receive publication-ready reports, visualizations, reproducible workflows, and expert scientific interpretation.

Deliverables

Every single-cell RNA sequencing project includes comprehensive analytical outputs that provide a detailed understanding of cellular diversity, gene expression dynamics, and biological function. All deliverables are reproducible, publication-ready, and tailored to your scientific objectives.

01

Quality Control & Cell Filtering

Comprehensive quality assessment, filtering of low-quality cells, doublet detection, normalization, and batch correction to ensure reliable downstream analysis.

01

Quality Control & Cell Filtering

Comprehensive quality assessment, filtering of low-quality cells, doublet detection, normalization, and batch correction to ensure reliable downstream analysis.

02

Cell Clustering & Annotation

Identification of distinct cellular populations through clustering and annotation using established marker genes and curated reference datasets.

02

Cell Clustering & Annotation

Identification of distinct cellular populations through clustering and annotation using established marker genes and curated reference datasets.

03

Differential Gene Expression

Identify marker genes and differentially expressed genes across cell populations, experimental conditions, or disease states using robust statistical approaches.

03

Differential Gene Expression

Identify marker genes and differentially expressed genes across cell populations, experimental conditions, or disease states using robust statistical approaches.

04

Trajectory & Cell–Cell Communication Analysis

Reconstruct cellular differentiation trajectories, infer developmental lineages, and investigate intercellular communication networks to understand dynamic biological processes.

04

Trajectory & Cell–Cell Communication Analysis

Reconstruct cellular differentiation trajectories, infer developmental lineages, and investigate intercellular communication networks to understand dynamic biological processes.

05

Functional Enrichment Analysis

Gene Ontology (GO), KEGG, Reactome, and pathway enrichment analyses to characterize the biological functions and molecular pathways associated with each cell population.

05

Functional Enrichment Analysis

Gene Ontology (GO), KEGG, Reactome, and pathway enrichment analyses to characterize the biological functions and molecular pathways associated with each cell population.

06

Publication-Ready Reports & Visualizations

Receive high-quality UMAP and t-SNE plots, heatmaps, violin plots, dot plots, trajectory visualizations, cell interaction networks, statistical summaries, and expert biological interpretation ready for publication and presentation.

06

Publication-Ready Reports & Visualizations

Receive high-quality UMAP and t-SNE plots, heatmaps, violin plots, dot plots, trajectory visualizations, cell interaction networks, statistical summaries, and expert biological interpretation ready for publication and presentation.

Get in touch.

Whether you have questions or just want to explore what’s possible, we’re here to help.

Get in touch.

Whether you have questions or just want to explore what’s possible, we’re here to help.